How to Read Crypto Candlesticks Without Mistaking a Pattern for a Promise
A candlestick compresses price information from one interval into a body and wicks. Learning to read it helps you describe what happened. It does not tell you with certainty what will happen next. Start with the.
Educational guide. Examples are hypothetical, not live quotes. Not personalized investment advice.
A candlestick compresses price information from one interval into a body and wicks. Learning to read it helps you describe what happened. It does not tell you with certainty what will happen next. Start with the data encoded in one candle before memorizing pattern names.
The four prices in every candle
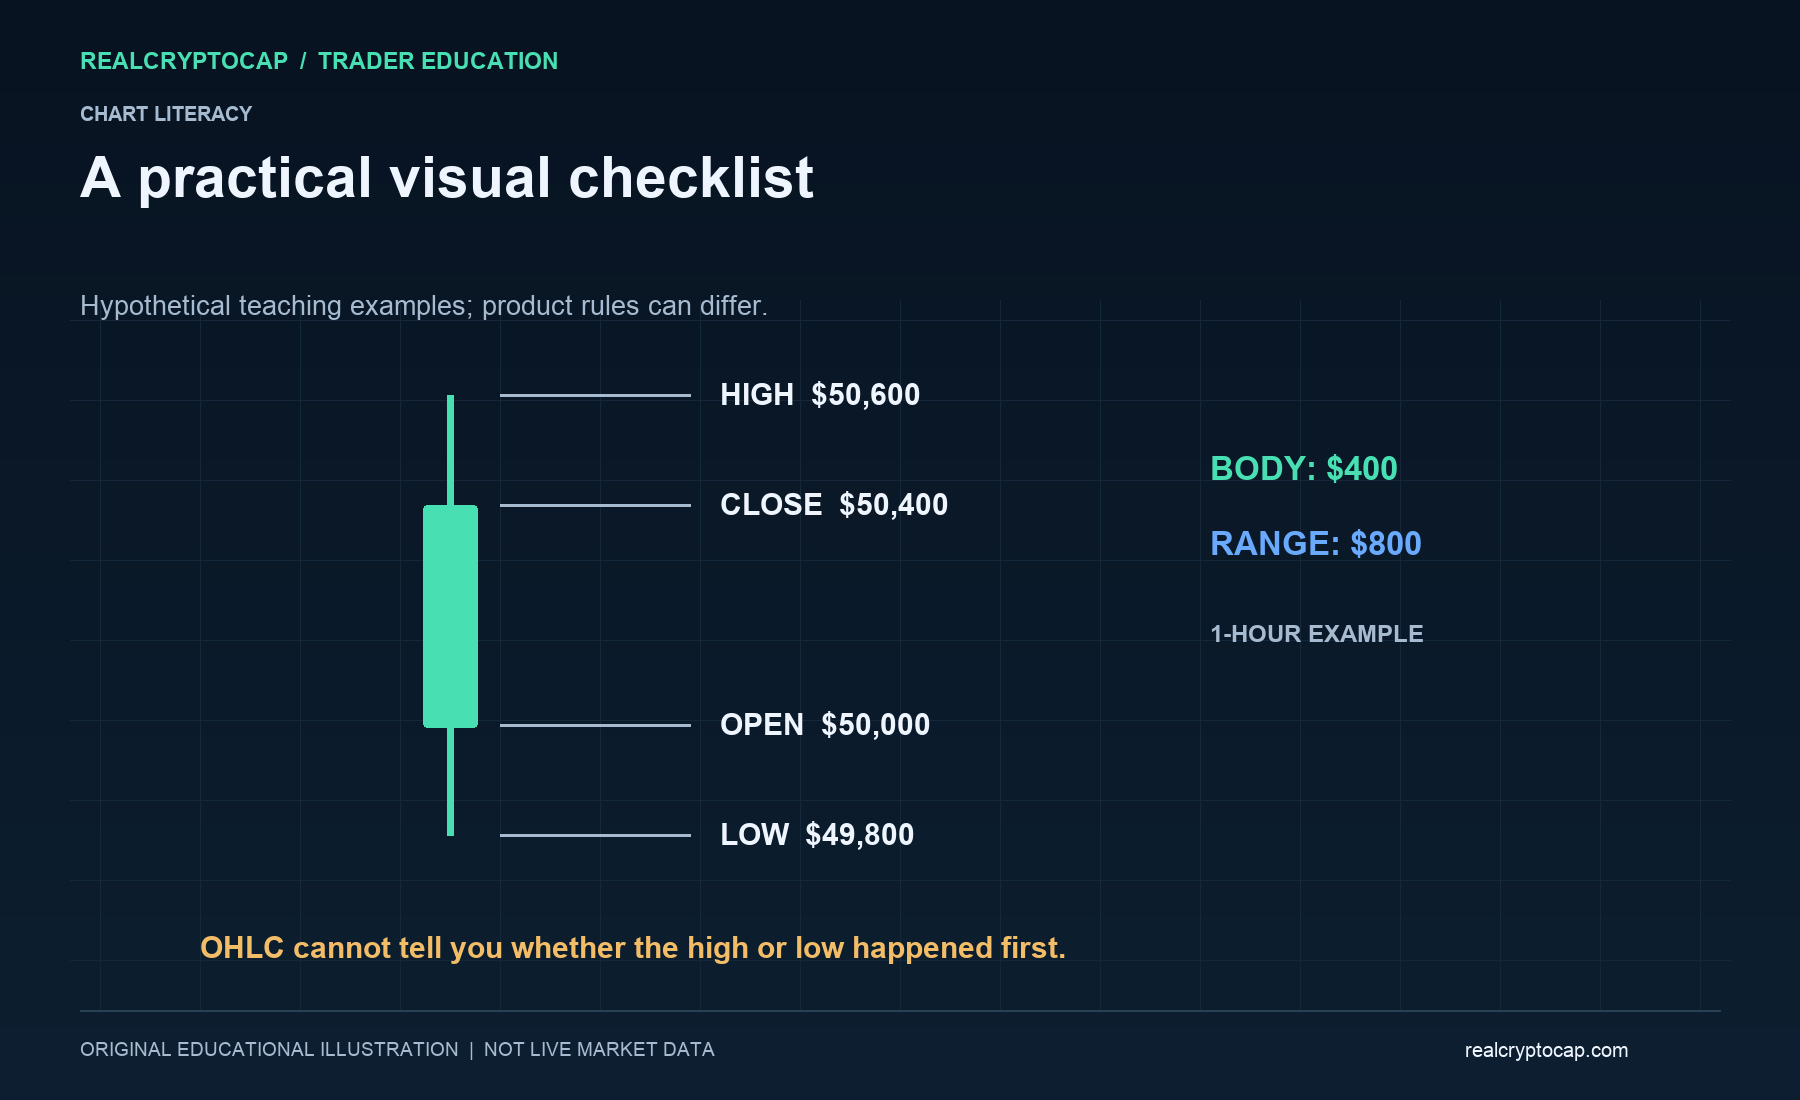
Open is the first recorded price in the interval, high is the highest, low is the lowest, and close is the last. Together these are OHLC. The body spans open to close. Wicks extend from the body toward the high and low. A candle's total range is high minus low; its body size is the absolute difference between close and open.
On common color settings, green means the close is above the open and red means the close is below the open. Platforms can use other colors or hollow bodies, so inspect the chart settings. A green candle can still close below the previous candle's close; color describes the current candle's open-to-close relationship.
Read one worked example
Suppose a one-hour BTC candle opens at $50,000, trades as high as $50,600 and as low as $49,800, then closes at $50,400. It has a $400 body and an $800 range. The upper wick is $200 and the lower wick is $200. Those hypothetical prices describe that hour only.
They do not reveal whether the high or low came first. Nor do they reveal every transaction, the order-book depth, or how much size could have traded at any particular level. Two very different intrahour paths can create the same finished candle.
Timeframe changes the picture
A five-minute candle and a daily candle summarize different information. A long lower wick on one timeframe may be several ordinary candles on another. Confirm the selected interval and the venue's daily boundary or timezone. Crypto trades around the clock, but daily-candle cutoffs are still conventions.
Distinguish a live candle from a completed one. Its close, body and wicks can keep changing until the interval ends. If your rule requires a completed candle, acting early is a different rule. This distinction also matters in historical tests: https://realcryptocap.com/articles/crypto-backtesting-beginners-guide.
What familiar shapes can and cannot say
A doji has an open and close that are close together relative to the relevant context. It indicates limited net movement during that interval, not a guaranteed reversal. A long lower wick shows price traded below the body before closing higher than the low; it does not prove a specific institution bought or that the next candle will rise.
An engulfing pattern compares neighboring bodies under a defined convention. It can be a useful descriptive label, but definitions vary and visual hindsight is persuasive. Specify the rule and evaluate it rather than collecting only examples that worked.
Add context before making a claim
Ask where the candle appeared relative to a broader trend and nearby trading ranges. Compare volume only after checking what that volume represents. One exchange's volume is not the entire market's activity, and high volume does not automatically validate a directional forecast.
Connect chart reading to execution. A candle's low does not guarantee your buy limit filled, and a stop price does not guarantee the eventual exit price. Read https://realcryptocap.com/articles/crypto-limit-orders-explained before translating a chart idea into an order. Fees, spread and slippage can overwhelm a pattern's apparent edge.
A five-question chart checklist
Which pair and venue is this? What interval and timezone does the chart use? Is the candle closed? What are the exact OHLC values? What would disprove my interpretation? If you cannot answer those questions, a pattern name is not yet a trading plan.
Use RealCryptoCap's https://realcryptocap.com/market-data for broader context and verify execution details on the relevant venue. Charts are tools for organizing observations, not promises of profit or substitutes for risk management.
Sources and further reading: CoinMarketCap Academy, How to Read and Analyze Japanese Candlestick Chart Patterns — https://coinmarketcap.com/academy/article/trading-101-how-to-read-and-analyze-candlestick-chart-pattern-in-day-trading. Independent educational synthesis with original OHLC illustration; no endorsement implied.